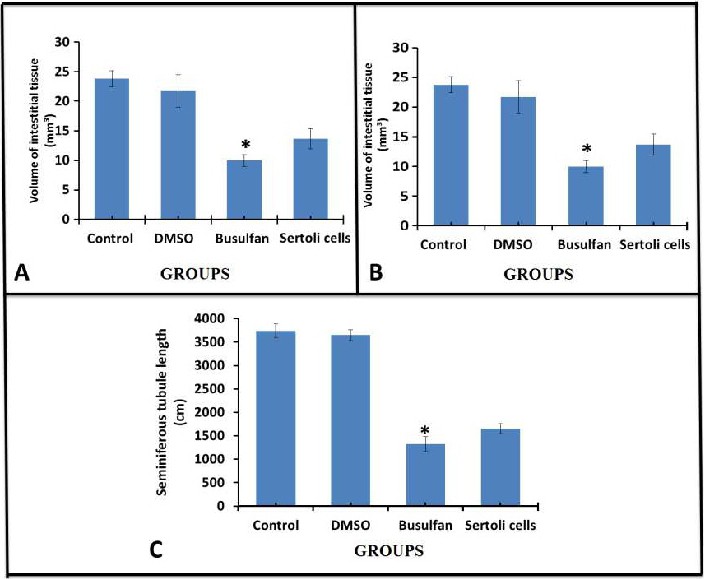
Fig. 3. (A, B) The total volume of testis and interstitial tissue in the different groups are shown. The significant difference between busulfan groups in comparison to the control and DMSO groups is indicated. *p<0.01. (C) The total length of seminiferous tubules in the different groups are shown. The significant difference between busulfan groups in comparison to the control and DMSO groups is indicated. *p<0.01.